LMS Reporting & Analytics

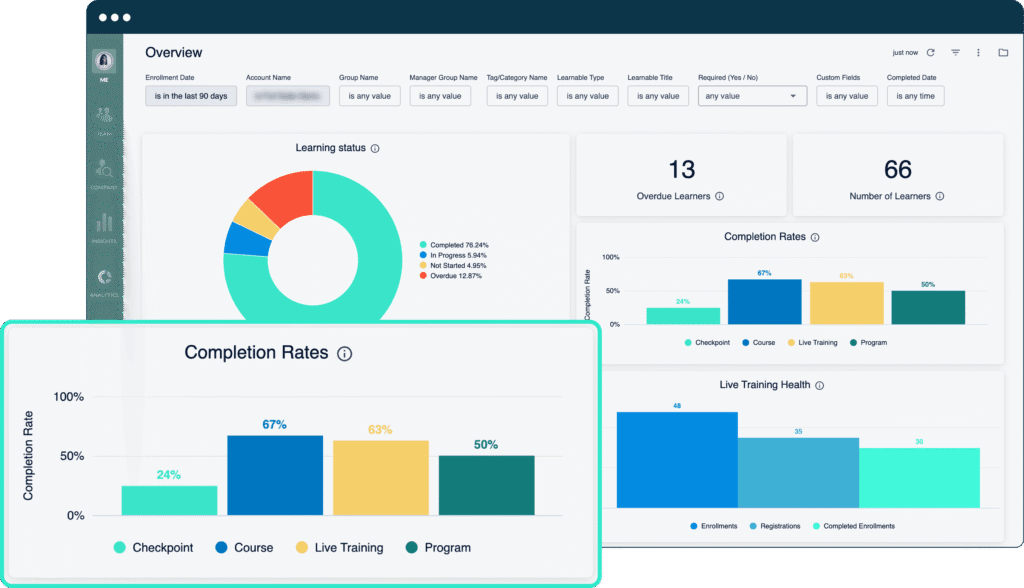
Measure the impact and ROI of your learning & development initiatives. Track enrollments, view course completion, identify overdue learners and more. View utilization and completion percentages, and measure how engaged employees are with your learning and training programs.
11M+
Learners
SOC II
Certification
4.2
G2 Rating
Bridge LMS Analytics
Trusted by people who develop people
Reporting & Analytics

Every program you run, measured in numbers

See what learners finished, what they skipped, and who’s about to miss a deadline. Pull the report in a few clicks, or schedule it to land in leadership’s inbox on its own.

See Overdue Learners

Catch who’s behind before the due date passes.

Track Engagement

Measure how engaged employees are with your programs.

Look at Usage

Logins and utilization, at an individual or team level.

1on1 Cadence

See how often managers are meeting with their teams.

View Course Enrollments

Every enrollment tracked automatically, with reminders sent.

Detailed Completion Metrics

Completion rates and program status in easy-to-read charts.

Enrollments

Track course enrollments

Bridge tracks course enrollments automatically and sends automated reminders. See everything at a glance with easy-to-interpret charts and graphs, including completion rates and training program status.

Report Distribution

Share reports with others

Automate report distribution so your leadership teams are always in the know. Create a report, pick how often you want updates and who receives them, then hit send. Choose from a variety of file formats.

Start measuring learning impact today

Easily measure the impact of your learning programs, and show leadership what changed.

Metrics

Track usage and engagement

View employee usage metrics like logins, how often managers are meeting with their teams, and assess skills coverage in the organization. View reports at an individual or team level.

Custom Configurations

Build the report you actually need

Create custom reports using metrics and analytics with configurable filters like learner type, user groups, course type, progression, due dates, and more.  

Works with the tools you already use

Have questions?

Frequently Asked Questions

What is learning analytics?

Learning analytics helps organizations measure and improve employee learning and development through data and reporting insights. Learning analytics are crucial for tracking track training completion, learner engagement, skill development, compliance progress, and workforce performance.

How does Bridge Analytics help measure learning ROI?

Bridge Analytics helps you measure learning ROI by tracking engagement, course completion, learning activity, and employee development trends. Reporting dashboards help you understand how learning programs support workforce growth and business performance objectives.

Does Bridge Analytics include custom reporting?

Yes. Bridge Analytics includes configurable reporting tools that allow you to create custom reports using filters such as learner type, course type, due dates, user groups, and progression metrics.

Can Bridge Analytics identify overdue learners?

Absolutely! Bridge Analytics helps you quickly identify overdue learners. You can also monitor compliance training progress, and track completion rates through reporting dashboards and automated learning reports.

Can managers access analytics dashboards in Bridge?

Yes. Bridge is built for helping your managers do their best work. With access to analytics dashboards that help them monitor team skills, employee development activity, learning engagement, and workforce trends, managers easily support employee growth and workforce planning.

What are the benefits of learning analytics software?

Learning analytics software helps you measure training effectiveness, improve visibility into employee learning, and support workforce development decisions through data and reporting insights. Track learner engagement, identify skill gaps, monitor compliance training, improve learning ROI, and make more informed employee development decisions.

Can Bridge Analytics help improve compliance reporting?

100%! Bridge Analytics helps you monitor compliance training completion, overdue learners, certifications, and workforce training activity through centralized dashboards and reports. Need to communicate results to senior leadership? Reports can be automatically scheduled and delivered to stakeholders, helping improve audit readiness, compliance visibility, and decision-making.

What can organizations track with Bridge Analytics?

Everything you need to drive upskilling! Enrollments, course completions, overdue learners, employee engagement, learning usage, manager activity, and workforce development metrics are all a breeze to track. Even better? Bridge’s analytics dashboards give you better visibility into learning and training performance and helps you communicate value to even your most challenging stakeholders.

See why 1,000+ companies choose Bridge

Join thousands of organizations that trust Bridge to power their learning.

Measure What Learning Changed

Show leadership what training actually did

Turns the data your learners create into completion rates, usage trends, and a report leadership can read on its own.

Speak with a Bridge LMS expert today!

Use your business email so we can route you correctly.